Analyzing Flow Cytometry Results
Learn how to analyze flow cytometry results, including measuring cells, gating the data, analyzing data and more.
A histogram based on flow cytometry ANdata helps users visually summarize data distribution, identify patterns or outliers, and understand the variations and trends.
Flow cytometry is an effective technique in biology, immunology and medical diagnostics to analyze the characteristics of individual cells or particles in a heterogeneous mixture. The significance of flow cytometry lies in its ability to rapidly identify and quantify specific cell populations.
In flow cytometry, cells or particles are suspended in a fluid stream and passed through a laser beam one by one. The laser excites fluorescently labeled antibodies, or dyes, on the cell surface or intracellular components to produce a unique signal recognized by detectors.
Flow cytometers can measure several properties of individual cells, such as size, granularity and fluorescence intensity, by analyzing the intensity and wavelength of the emitted light.
Flow cytometry results are typically represented as dot plots or histograms, with each dot or bar representing an individual cell or particle. Dot plots display two parameters on the x- and y-axes, while histograms display the frequency distribution of a single parameter.
By analyzing these graphs, researchers can identify specific cell populations based on their unique characteristics, such as the expression of surface markers, cell cycle stage, or apoptosis.
Because flow cytometry produces large amounts of data in histograms, scatter plots and other graphical representations, the information can be difficult to interpret without proper training and experience. Additionally, the instrument settings, sample preparation and data analysis can affect the quality and accuracy of the results.
Flow cytometry data analysis
In flow cytometry, individual cells or particles are stained with fluorescent dyes and passed through a laser beam one at a time.
The laser excites the fluorescent dyes and a photodetector detects and quantifies the resulting fluorescence. Flow cytometry can provide information on cell size, shape, complexity and the expression of specific proteins or other molecules by analyzing the fluorescence’s intensity and wavelength.
When conducting flow cytometry, there are several factors to consider, such as appropriate fluorophores and controls, optimizing staining and sample preparation protocols and choosing appropriate gating strategies to identify and analyze subpopulations of interest. Here are the steps for cytometry data analysis.
Visualizing data plots
After data has been collected, the first step in the analysis is data visualization using dot plots or histograms. These plots help the users identify the subpopulation's presence and assess the data’s quality.
Data gating
The next step is to gate the data, where a specific subset of the data is selected for analysis. This can be done either manually or by using automated gating algorithms. However, it’s essential to carefully consider gating strategies to ensure data transparency.
Performing statistical analyses
After gating, various statistical analyses can be performed to study the characteristics of the selected subpopulations. The analyses may include measures such as mean fluorescence intensity, coefficient of variation and skewness.
Comparing the data
Finally, the flow cytometry data analysis compares the data to appropriate controls to ensure that any observed differences are significant and not due to experimental artifacts.
How to analyze flow cytometry data
Flow cytometry can help determine physical and chemical characteristics of a sample. Interpreting flow cytometry data involves several steps, including data preprocessing, visualization, gating and statistical analysis. Here are some general techniques for analyzing flow cytometry data:
Preprocessing the data
It is essential to preprocess the flow cytometry data before analyzing it. Preprocessing includes removing background noise, compensating for spectral overlap and normalizing the data to account for variations in fluorescence intensity between samples.
Visualizing the data
Visualization is an important step in flow cytometry data analysis and helps identify patterns and outliers, if any, in the data. Several visualization techniques are available, including dots, histograms and density plots.
Gating
Gating is a fundamental step in flow cytometry analysis. It involves identifying and separating individual cells within a heterogeneous population, based on their physical and chemical characteristics.
Several gating strategies are available, such as forward and side scatter gating, histogram, dual color fluorescence density plots and backgating. Each gating strategy has advantages and limitations.
Statistical analysis
Statistical analysis can be performed after cell populations have been identified to compare the characteristics of different cell populations. The analysis involves measures such as mean fluorescence intensity, coefficient of variation and fold change.
Reporting the results
The last stage, as expected, is accurately and concisely reporting the results. It should include a description of the gating strategy, statistical analysis and any relevant biological interpretation of the results.
Gating strategies for flow cytometry data analysis
As mentioned previously, one of the primary steps in flow cytometry data analysis is gating. The process involves selecting a subset of cells based on specific criteria.
Gating is essential to remove dead cells and non-specific staining that can often be a reason behind unclear data interpretation. It also helps identify the distinct and critical cell populations for downstream analysis, such as cell sorting, gene expression and functional assays.
Different gating strategies can be used depending on the specific research question and the nature of the sample. Below are some common gating strategies below.
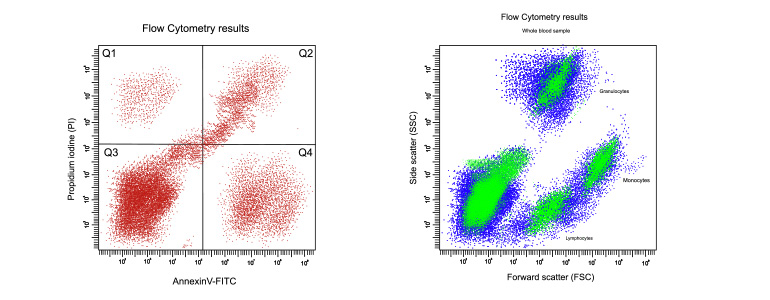
Forward and side scatter gating
This flow cytometry gating strategy is used to isolate a specific population of cells from a heterogeneous sample depending on their size and granularity. This method allows the sample to pass through a laser beam so that forward and side scatter signals can be detected and recorded for each cell.
This gating strategy differentiates between cell types or subpopulations based on their physical properties. For instance, lymphocytes are generally smaller and have lower granularity than granulocytes. As a result, lymphocytes are easily isolated from other cell types by setting appropriate gates on the forward and side scatter signals.
Forward and side scatter gating allows more accurate and precise identification of specific cell types or subpopulations in research and clinical applications.
The steps involved in this gating strategy may vary depending on the specific flow cytometry instrument and software. However, the following steps are usually part of the process:
- Acquire data for the sample using the flow cytometer.
- Plot the forward scatter (FSC) on the x-axis and the side scatter (SSC) on the y-axis to create a scatter plot.
- Use the scatter plot to set appropriate gates around the population of interest based on their physical properties.
- Analyze the gated population to obtain the desired data.
Histogram
A histogram is an effective gating strategy that can help identify the underlying frequency distribution of a set of continuous data. A histogram displays the data in bars that represent ranges of data values called bins. The height of each bar represents the frequency of data values falling within that bin.
Histograms aim to visually summarize data distribution, identify patterns or outliers, and understand the variations and trends. They are valuable because they can quickly convey a large amount of information about data distribution. By examining the shape of the histogram, one can quickly determine whether the data is symmetric or skewed, unimodal or multimodal and whether there are any outliers or gaps in the data.
The following steps are taken to create a histogram:
- Start by choosing the appropriate number of bins to group the data.
- Then, determine the range of the data values and divide the range by the number of bins to get the bin width.
- Count the number of data values that fall within each bin.
- Then, plot the frequency of data values for each bin on the y-axis and the range of data values for each bin on the x-axis.
- The last step is to create bars representing each bin's frequency of data values.
Dual color fluorescence density plots
Dual-color fluorescence density plots are a data visualization method that helps analyze the distribution of two different fluorescently-labeled populations within a sample. This technique is commonly used in flow cytometry experiments to study multiple parameters of cells or particles.
This method helps visualize the relationship between two fluorescence parameters by plotting the density of cells or particles in a two-dimensional space. These density plots can provide valuable information about the relative abundance of different cell or particle types within a sample and identify subpopulations based on their distinct fluorescence characteristics.
This type of data analysis is a significant flow cytometry gating strategy that helps reveal patterns and relationships in a simple scatter plot. By visualizing the density of cells or particles, these density plots can help researchers identify rare or unusual subpopulations, which isn’t possible with other analysis methods.
The following steps are typically followed to create a dual-color fluorescence density plot:
- Start by acquiring flow cytometry data using a dual-laser instrument that detects two fluorescent dyes.
- Gate the population of interest based on forward and side scatter characteristics.
- Create a bivariate plot that displays the two fluorescence parameters of interest on the x and y-axis.
- Adjust the plot settings to visualize the density of cells or particles within the plot space.
- Finally, analyze the plot and identify the subpopulations.
Backgating
Backgating is a tool that helps define the population of cells by excluding cells that do not meet prior gating criteria.
Backgating works to increase the specificity and accuracy of an analysis by eliminating background noise and artifacts from the data. It is especially important when analyzing complex cell populations where multiple cell types may be present. The backgating step helps improve the data resolution and can lead to more reliable conclusions by removing the cells that don’t fit the criteria.
Backgating can be performed using software programs that let the user select cells from previous gates and exclude them from the subsequent analysis. The backgating step can be repeated multiple times until the desired level of specificity is achieved.
Learn more about Avantor’s flow cytometry solutions
Avantor Sciences provides various flow cytometry solutions that enable accurate and efficient analysis of cell populations. Offerings include instruments, reagents and software to support research, clinical and diagnostic applications.
Flow cytometry instruments include the Attune NxT Flow Cytometer, which offers high sample throughput and precision for cell analysis and the CytoFLEX Flow Cytometer, which delivers exceptional sensitivity and resolution for small particle detection.
In addition to the instruments, Avantor Sciences offers a range of flow cytometry reagents, including fluorochrome-conjugated antibodies, buffers and cell viability dyes. These reagents enable researchers to label specific cell populations for identification and analysis.
Sources: